Expected goals ratings are not something of which I have not seen a lot on UpTheSaddlers, but they are relatively simple to understand and they attempt to provide objective snapshots of football matches, something with which many of us struggle because of our emotional biases. Let’s face facts: no rational, unemotional person would continue to pay good money to support Walsall given what the club gives back in return. To varying degrees, all Saddlers fans are mad.
One look at Walsall’s recent expected goals data, which I have uploaded in the form of Experimental 3-6-1’s excellent infographics, and you know something has to change - perhaps many things have to change - if the Saddlers are not going to get sucked into a relegation dogfight this season.
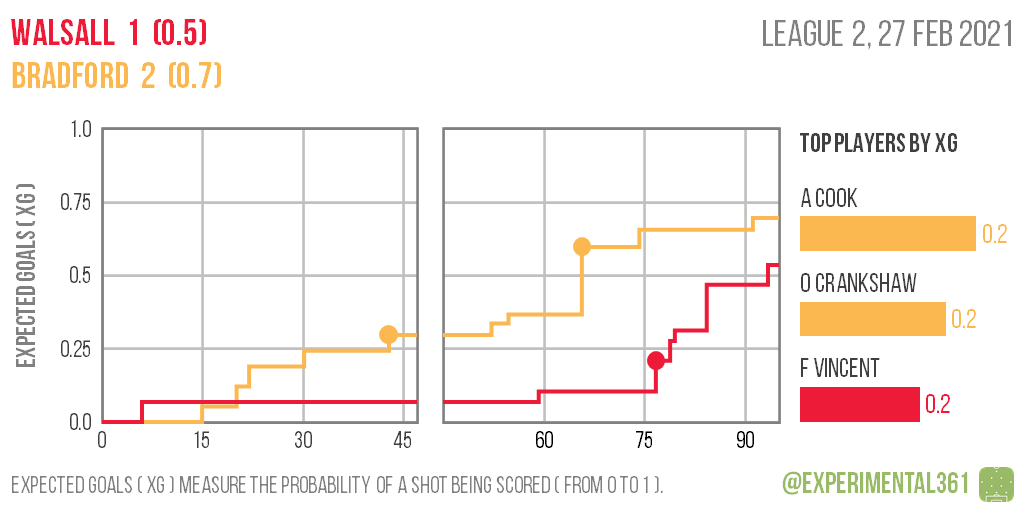
Nothing positive has come out of Walsall’s first four games under Brian Dutton, and to the person who tweeted the Saddlers were on top before Bradford took the lead - I am referring to you, Liam Keen, of the Express & Star - think again. However, I have just seen your Walsall player ratings - three sevens, five sixes and three fives among the starting line-up - and thinking about football is not your strong suit.
4 Likes
I think the xG is brilliant and confirms what I have thought… Dutton’s first 4 games, for all of the passing play and it being a relief from the hoof ball, hasn’t really shown much offensively or defensively. It has been the case all season though, despite the ball being on the floor, not much has actually changed yet sadly.
3 Likes
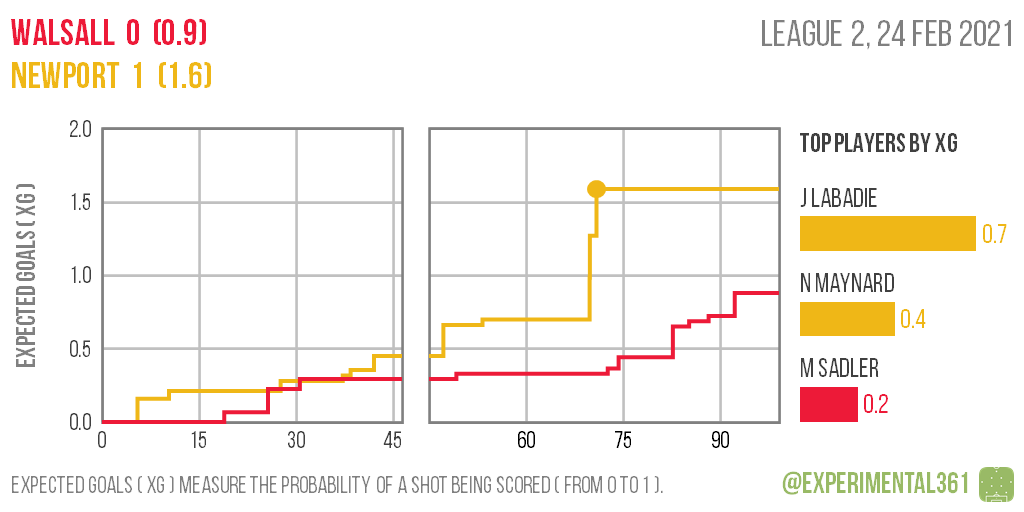
The XG v Cheltenham suggests we had a very good chance after they scored.
Anyone remember what that chance was? Maybe something to do with Sadler?
I’ve rewatched the game. It was a chance Sadler had in the penalty area. It didn’t ‘look’ that good a chance, so interesting that this model gave it such a high xG.
I tried to press play twice ffs 
2 Likes
I’m feeling a bit inadequate here, as I haven’t a clue what those graphs really mean.
Each ‘jump’ in the graph represents a chance for Walsall (or the other team depending on the colour). The bigger the jump, the better the chance.
Does that make sense?
1 Like
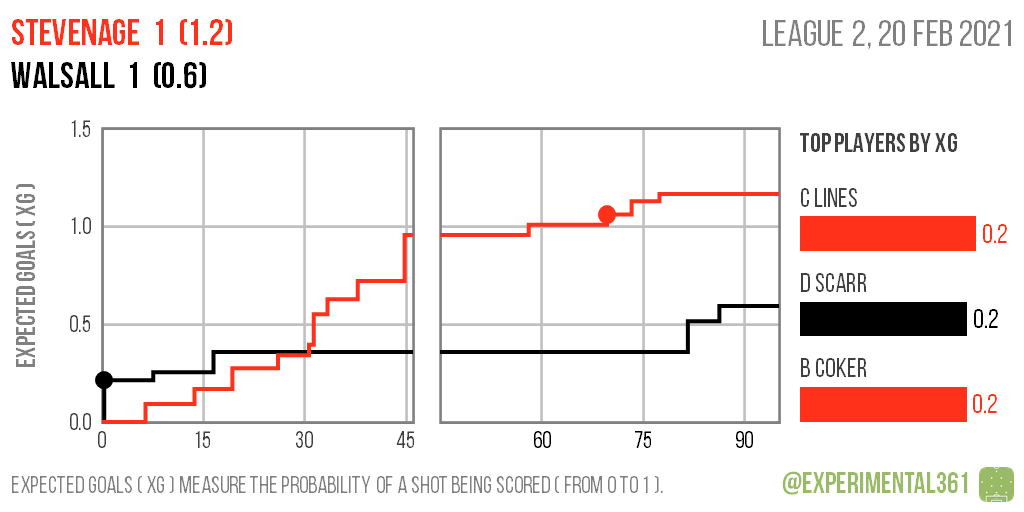
I’ve just noticed our most likely scorers according to those charts were Sadler and Scarr in 3 out of the 4 games. That’s quite something, and suggests creating chances is our problem.
2 Likes
The model did not give it a high xG, Andy. Look at the Y axis; the spike looks big but the scale is small because the match had so few good goal-scoring chances in spite of it featuring three goals.
Not only that but no Walsall player has had an individual chance assessed as having a better chance of conversion than 20 per cent in Dutton’s four games. Also, the Walsall player who ended the Bradford match with the team’s highest xG would not have taken part in the game if someone had not injured themselves during the preliminaries. That the Frank Vincent soap opera was not the main topic of post-game interviews says a lot - and none of it complimentary - about the standard of the local media.
These are truly shocking statistics and highly objective data because of the formulae behind xG numbers. For context, xG rates a penalty kick at about 0.7 because history shows about 70% of penalties are scored in professional football. For anyone who wants to know more about xG, browse Experimental 3-6-1’s website at https://experimental361.com.
1 Like
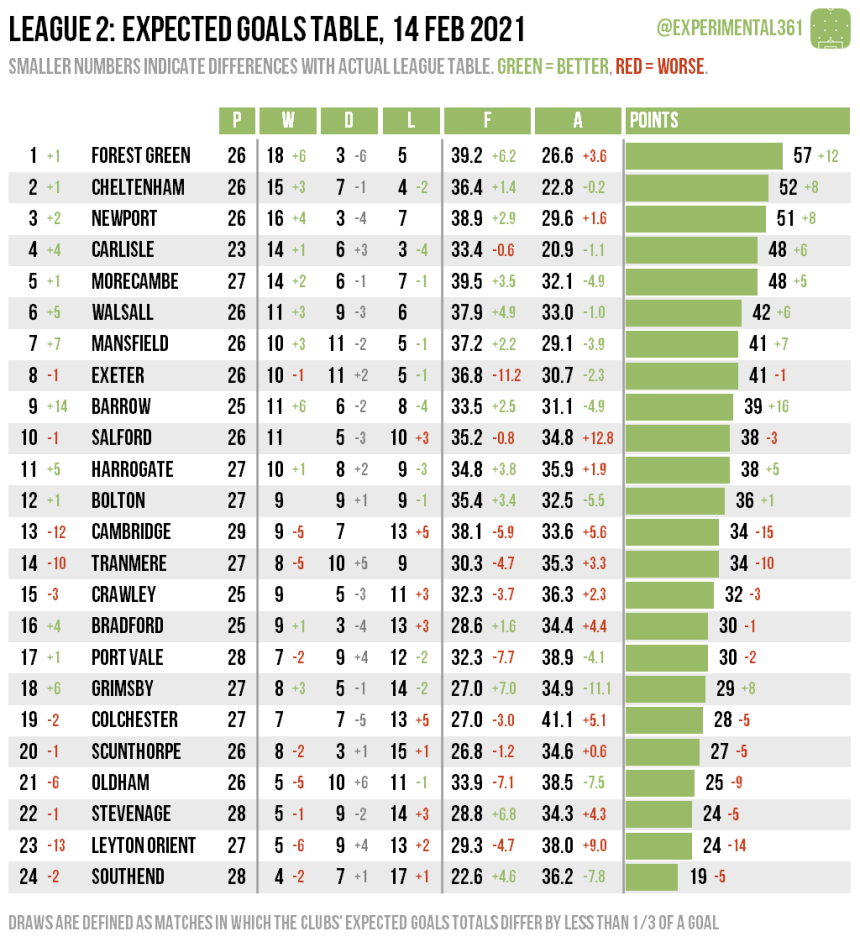
These are Experimental 3-6-1’s League Two tables before Brian Dutton succeeded Darrell Clarke and after Dutton’s first four matches.
In summary, Walsall should have won 11, drawn nine and lost six of its 26 League Two games under Clarke based on xG, with the major reason why the Saddlers fell short of their expected points being their actual goals falling well short of their expected goals. You can put down that to poor finishing by those who had the chances, including the recently transferred Elijah Adebayo.
Under Dutton, Walsall should have won zero, drawn two and lost two of its four matches, so you could argue the Saddlers are travelling worse under their new manager than their old one. And I would argue that precise point even though I cannot stand Clarke, both personally and professionally.
According to xG, Forest Green, Cheltenham and Newport are League Two’s best three teams, while Mansfield, Barrow, Cambridge, Tranmere and Leyton Orient are among the division’s sides which are not receiving their just desserts in real life.
Finally, note Port Vale’s fortunes over the same short period of time. It would appear Clarke’s coaching badges are not improving Walsall’s rival up the M6. Hands up if any of us are surprised.
4 Likes
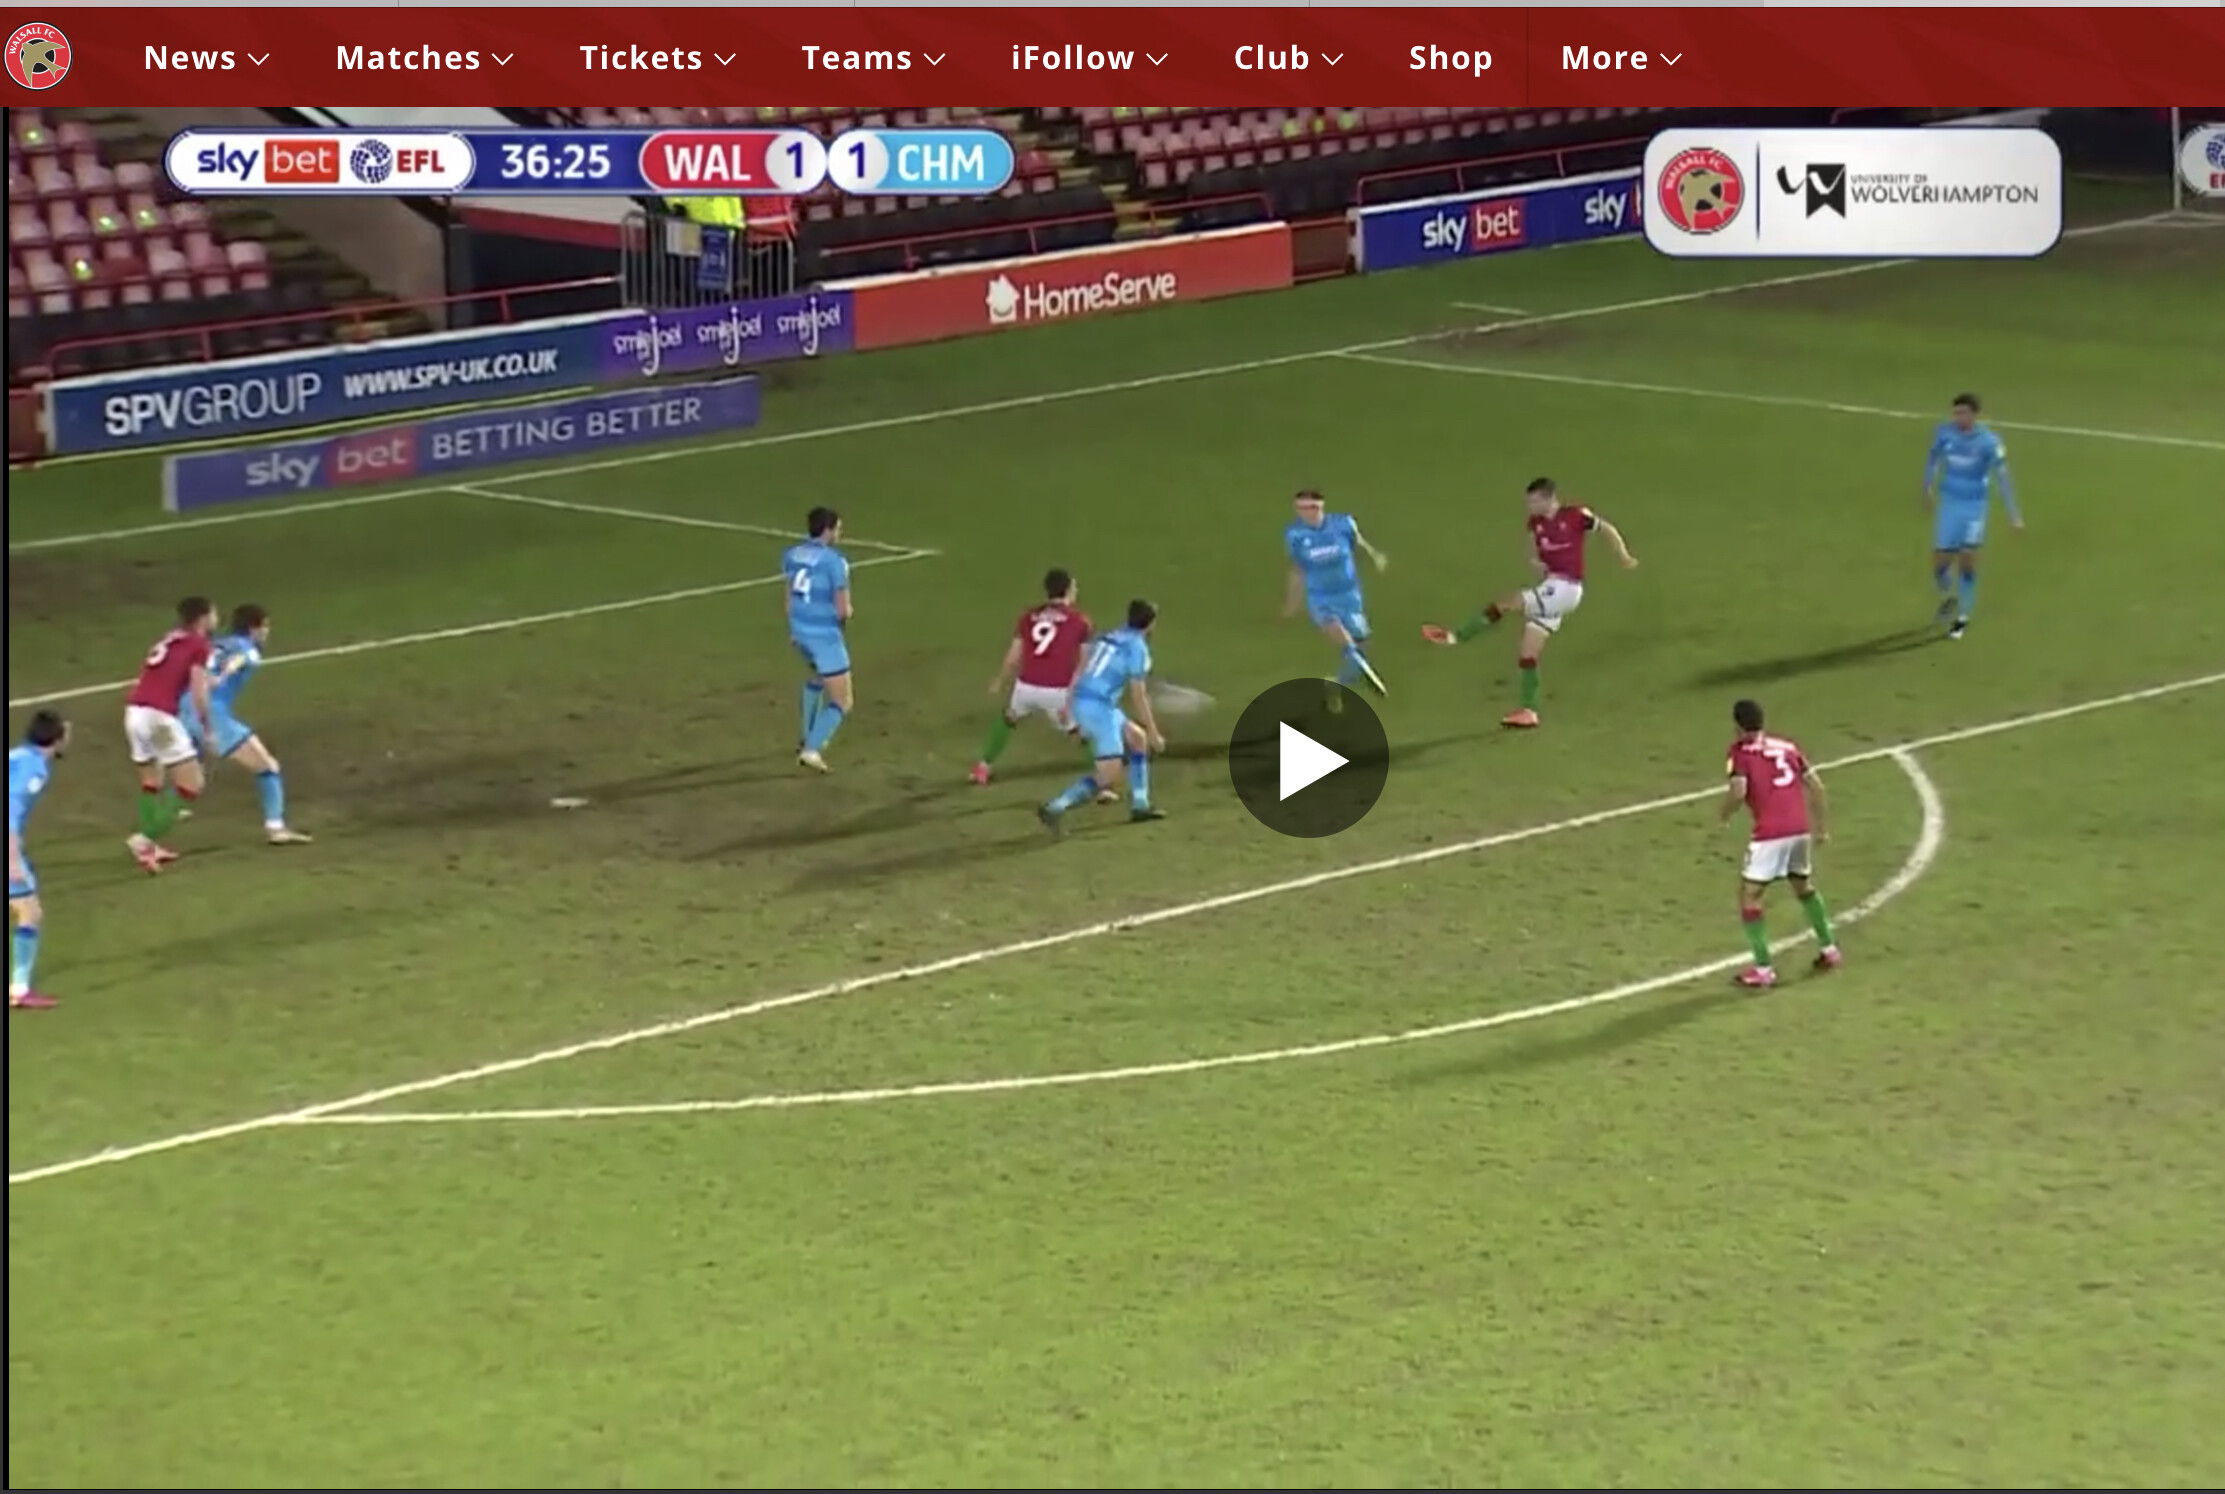
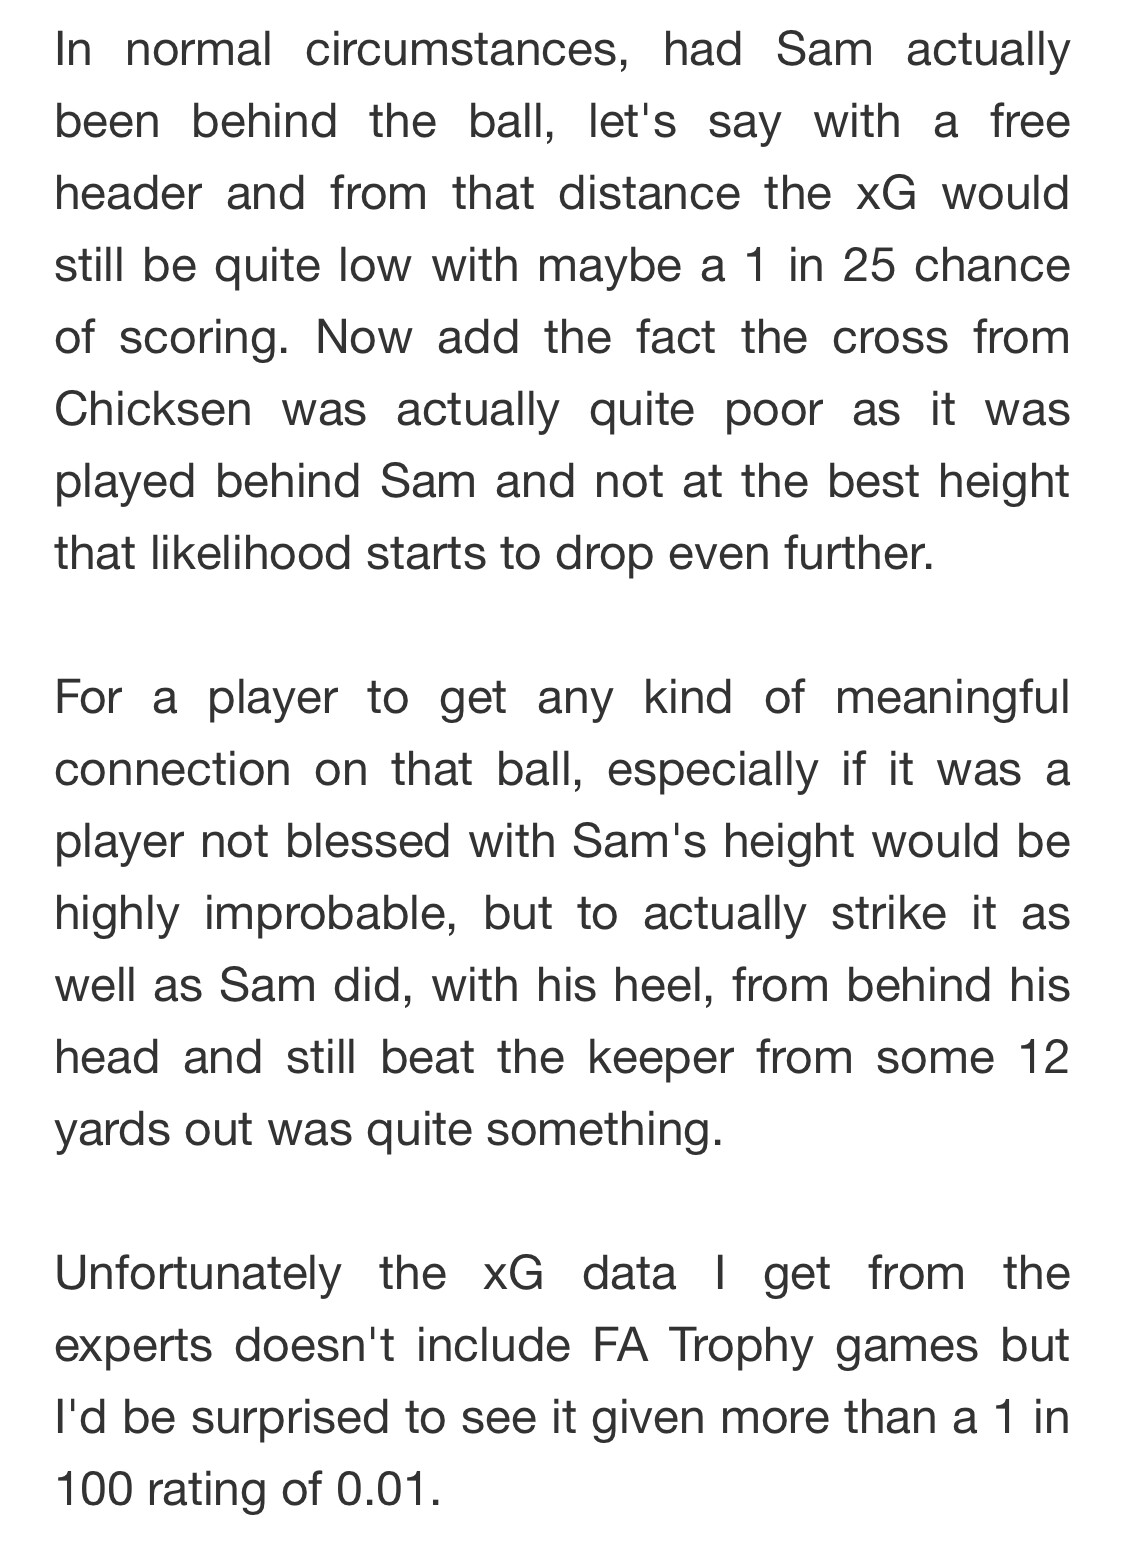
Where would this go on an xG graph?
1 Like
Reminiscent of Ned Kelly’s goal against Notts in the play-off semi final.
1 Like
Very Good question (If you are genuinely asking)
Given the position of the shot, you would say high xG
But given the player had his back to goal you’d say low xG
That’s why xg is still a bit subjective. How a particular model assigns xG can vary from model to model.
The better model would allow for the position of the shot and the fact the player had his back to goal.
2 Likes
Because I’m incredibly bored, I’ve found what nottscountystats has to say on it… Their site seems pretty good, know their stuff!
2 Likes
This stuff is going over my head (what does that do to the xG?), what’s the point of it all? Is it used for any useful purpose?
There are a few uses but the main use is to assess if a team was fortunate or unfortunate in a given game.
For example, if there was a ‘graph’ of the notts county game, that back heel goal would appear as a very small jump and contribute very little to the expected goals. However it contributed ‘1’ to actual goals. So, it could be concluded that Notts County were lucky in this game.
That may appear obvious from just one chance, but when there are multiple chances in a game (as there generally is) it’s a lot harder to say which side was luckier. By aggregating all the chances, xG helps quantify this, by comparing the xG with the actual goals.
Over time it can help identify teams which are playing better than their results suggest. E.g. in Aussie Saddlers table, Barrow are mid table. Consequently a lot of people think Barrow will pull any from the relegation zone because xG suggests they are playing better than their results suggest.
1 Like