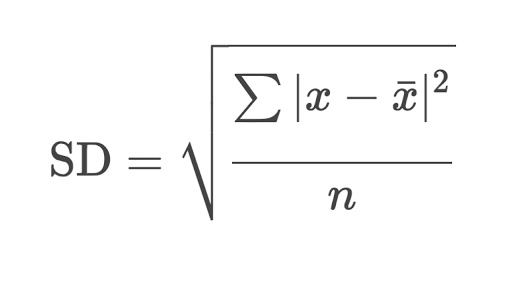
Stats head on here.
Could you show the standard deviation for each point for the averaged across data there - will clearly show else are outside the norm then.
Don’t apologise. This is good stuff and absolutely demonstrates failure by using data rather than us just finding different ways to try to express why we think our board isn’t doing great and indeed hasn’t done great for some time.
Another interesting takeaway from this is that wherever you plot “year zero” we are further away now from average third tier crowds than we have ever been. Jeff will often take year zero as being around 1992/93 I.e when he went from director to owner/chairman. That’s a useful year zero for him as it was a particularly low ebb. Successive relegations, administration and two years of finishing around 17th in the fourth division meant that he could point to “progress” through most lenses.
However, despite those four bloody awful seasons, our attendance were more third tier than they are now in that even at the biggest delta we were around 2,300 lower than average third tier whereas we are now more like 3,000. And that’s after a proceeding period that has seen four promotion campaigns, four seasons in the second tier, only our second ever honour, a trip to Cardiff and a trip to Wembley.
Blimey, I haven’t heard that term since I was at school. I have no idea how to do that. Perhaps you could enlighten me?
Not a name, but our motto should be “wont get fooled again”.


I thought it was like seeing mention of an acquaintance from years ago as well. I can’t even remember if it means the same as statistical significance,but I think it’s in the same room. It would,I suspect be important.
Some excellent points throughout your contributions.
Obviously this season’s league statistics will see a massive upward spike due to Sunderland’s home gates.
Agree with an earlier comment about our geographical location meaning we get higher away attendances. It is a pity that the ‘home’ attendance data isn’t available though I am sure it would show a depressing trend.
I think the “Sunderland effect” this season can be seen in the mini spike in Tier 3 attendances 8-10 years ago when the mighty Leeds United were in our division.
Aside from a minor dip in averages in 2013, Tier 3 attendances have been remarkably steady, between 7k and 8k for 14 years. Ours have been fairly steady but in line with the bottom division’s attendances, aside from our “almost promotion” season - we haven’t recovered (as someone said) from that drop at the time of the Fox/Dann sale.
Don’t worry, he only wanted to sound clever. ![]()
I was under the impression Rimmer was sold to Barnsley because we were made to by our then owners de glen or whatever had their fingers in the pie at Barnsley this was only rumour
Just my stats head speaking!
Can’t know if the Walsall attendance figures are outliers or within the normal range without comparing to the variance!
Are those numbers in the graph just means or did you calculate the means from other data? It’s only possible if the latter! 
Your stats head could be very useful.
Can’t tell if sarcastic or not 
No I meant it.
Thanks mate! Will help out where I can! 
As well as looking at West Midlands its also telling that, generally teams in other major conurbations at our level don’t seem to have lost fans from 1987 to 2018 like we have. Your figures showed:
Villa: 18171 up to 32097
Albion: 9133 up to 24534
Blues: 7426 up to 21042
Wolves: 5754 up to 28298
Walsall: 5312 down to 4760
Teams in Man City & United’s vicinity:
Rochdale 2151 up to 3471
Bury 2502 up to 3931
Oldham 6882 down to 4442 (were in Championship equivalent in 1986/7)
In South Yorks
Rotherham 2987 up to 8514
Doncaster 2402 up to 8213
Scunthorpe 2126 up to 4384 (included here because they moved ground - and are near S Yorks!
Excellent work SuperGabor.
Are those graphs of home attendance only? Or do they include Away fans?
I think it might be a big job but to help with that, could we show our ranking? So in 1987 i think we are ranked 45 in the country and now we would be around 67th. The graph would show us tumbling down the league. Would need non-league data too as unfortunately we get fewer than say Wrexham this year and Tranmere last…
This would demonstrate the fall and flatten the data landscape from third tier outliers.
I think it is powerful enough already but you can’t beat really robust exhibits!!


